
There’s a simple workflow for price index formula you can follow to single out your real competitors, calculate their impact on your sales, adjust your pricing strategy, and avoid price wars. To find out who exactly influences your sales, you first need to calculate the Price Index.
How To Define Your Real Retail Competitors
The Price Index is a normalized average of price relatives for a particular category of products or services in a specific geographical region for a given time period. There are dozens of complex formulas used to explain the idea of PI, but we are here to share with you a much simpler method you can apply directly to your business with minimal effort.
Example:
The simplest example of Price Index usage is for the end of the week, month, quarter, or year when the retailer wants to discover the reasons why their net profit decreased. As long as the Price Index is directly connected to sales, it’s easy to see using historical sales and pricing data.
Below you’ll find a theoretical and practical part on how to calculate competitive pricing formula to define your real competitors and their impact on your sales.
Price Index Calculation
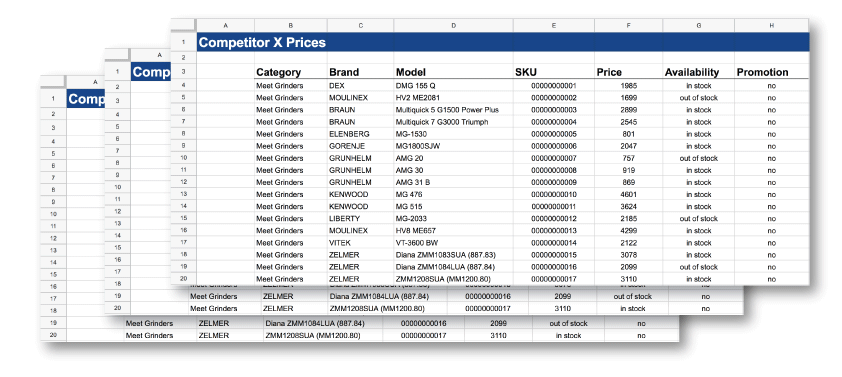
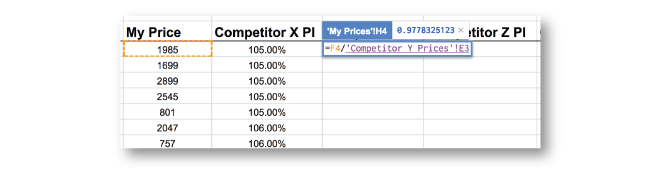
To calculate the price index, firstly, you need to collect all the price overlap pairs (the intersections of products that you and your competitors have).
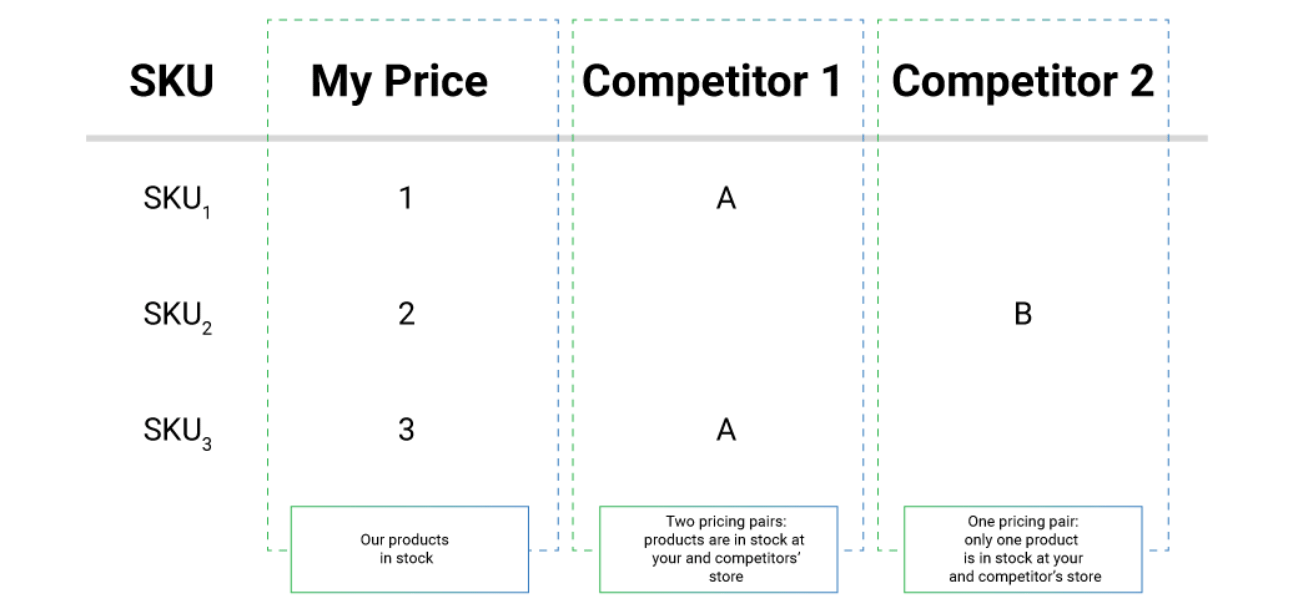 Once you have this information, you need average index formula for each product and for each competitor. To do this, you need to divide the cost of a competitor's product by the cost of a similar position from your range.

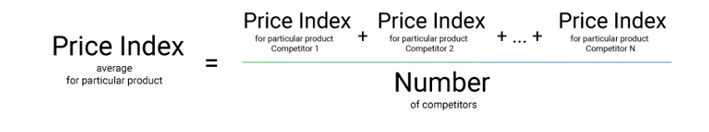
To find out your competitive price index, you can use the following formula: divide the sum of the received price indexes by the number of competitors.
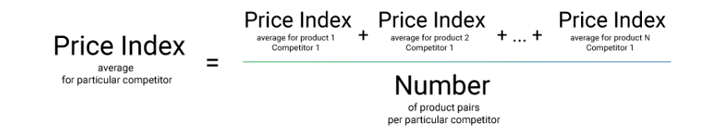
Lastly, to see how competitor prices influence your sales, you need to determine the average price index for each competitor. This can be calculated by the following formula:
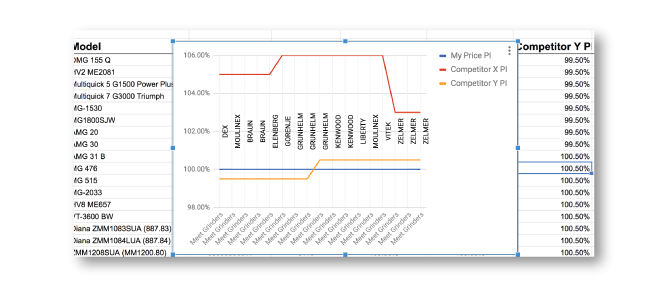
Now you can visualize all the data you’ve calculated onto a graph to discover all the deviations.
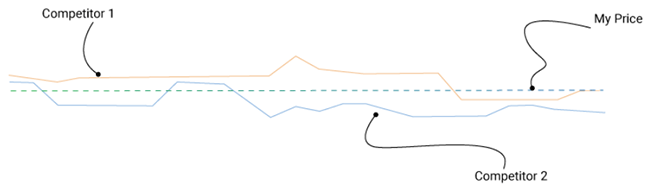
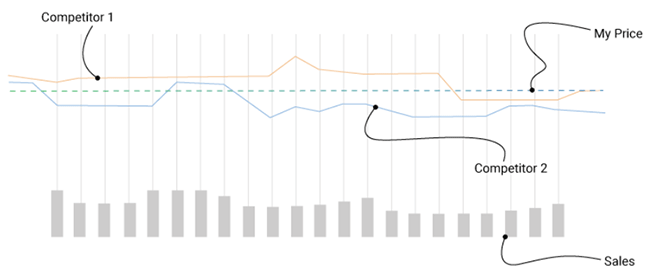
If you add your sales metrics to the same graph, you’ll be able to easily define which competitors impact your sales (in the graph below, Competitor 2 is the most impactful).
Going through the outlined workflow requires time and effort. The manual calculation of the average price index formula is, therefore, acceptable only for a limited group of retailers working with a few SKUs with relatively stable prices and demand. As a retailer reaches a particular size or maturity level, the automation of pricing-related operations becomes inevitable.
So How Exactly Can a Retailer Calculate The Price Index?
There’s a simple flow you can follow to calculate the Price Index using the above formulas.
-
Collect fresh and accurate competitive data on prices and stock
To get a reliable result, you need to use reliable raw data. This is why it is essential to monitor competitor’s prices and stocks on a daily basis. For some industries, e.g. electronics, it’s necessary to monitor prices multiple times per day. Otherwise, your data is likely to be outdated and you’ll be comparing yourself to competitor prices that no longer exist.
-
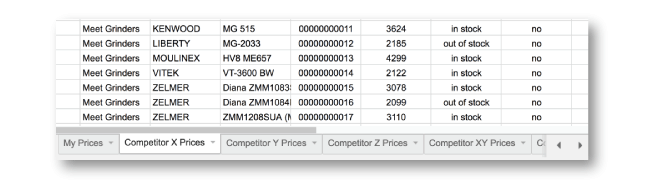
Create a Single Spreadsheet With All the Data You’ve Collected
In order to manage your data, you need to store it in a single place.
-
Apply Formulas From the Previous Paragraph
So long as you’re already familiar with MS Excel or another spreadsheet-building software, applying formulas to your data in your spreadsheet should not be too complex of a task.
-
Build a Chart
This bullet point is not obligatory, but very useful to better visualize deviations and recognize the dependencies between competitor’s changes and your sales results.
-
Add All Your Sales Data
As we mentioned before, the Price Index is useless without sales data. The Price Index shown by itself will give you market data but will tell you nothing about market impact without sales data.
-
Discover the Exact Activity That Affected Your Sales
With all of this information properly calculated and demonstrated, you’ll be able to see what and who affected your sales at a given time.
Complexity of Calculation
Implementing these calculations is easier said than done.
The first issue retailers usually face is regarding data quality. Some of them grab data from marketplaces, instead of taking data from their rival’s website directly. Other companies use self-made parsers. Some hire people to scrape data manually or buy cheap solutions that deliver low-quality data. This low-quality data often leads to poor pricing decisions.
However, even if you resolve any issues regarding data quality, you may still have problems with data processing or analysis. Errors caused by human factors can occur at any stage of this process; during data collection, its consolidation, analysis, or your repricing process, for example.
We, at Competera, provide businesses with pricing data with an accuracy of up to 98%. What it means is that our clients get fresh and correct information about prices, promos, availability, product visual representation, customer reviews, and other data from competitors’ websites. The data is processed and analyzed by our pricing engine to build the graph of the price index. The image below shows an example of how the price index is visualized in the software's interface. 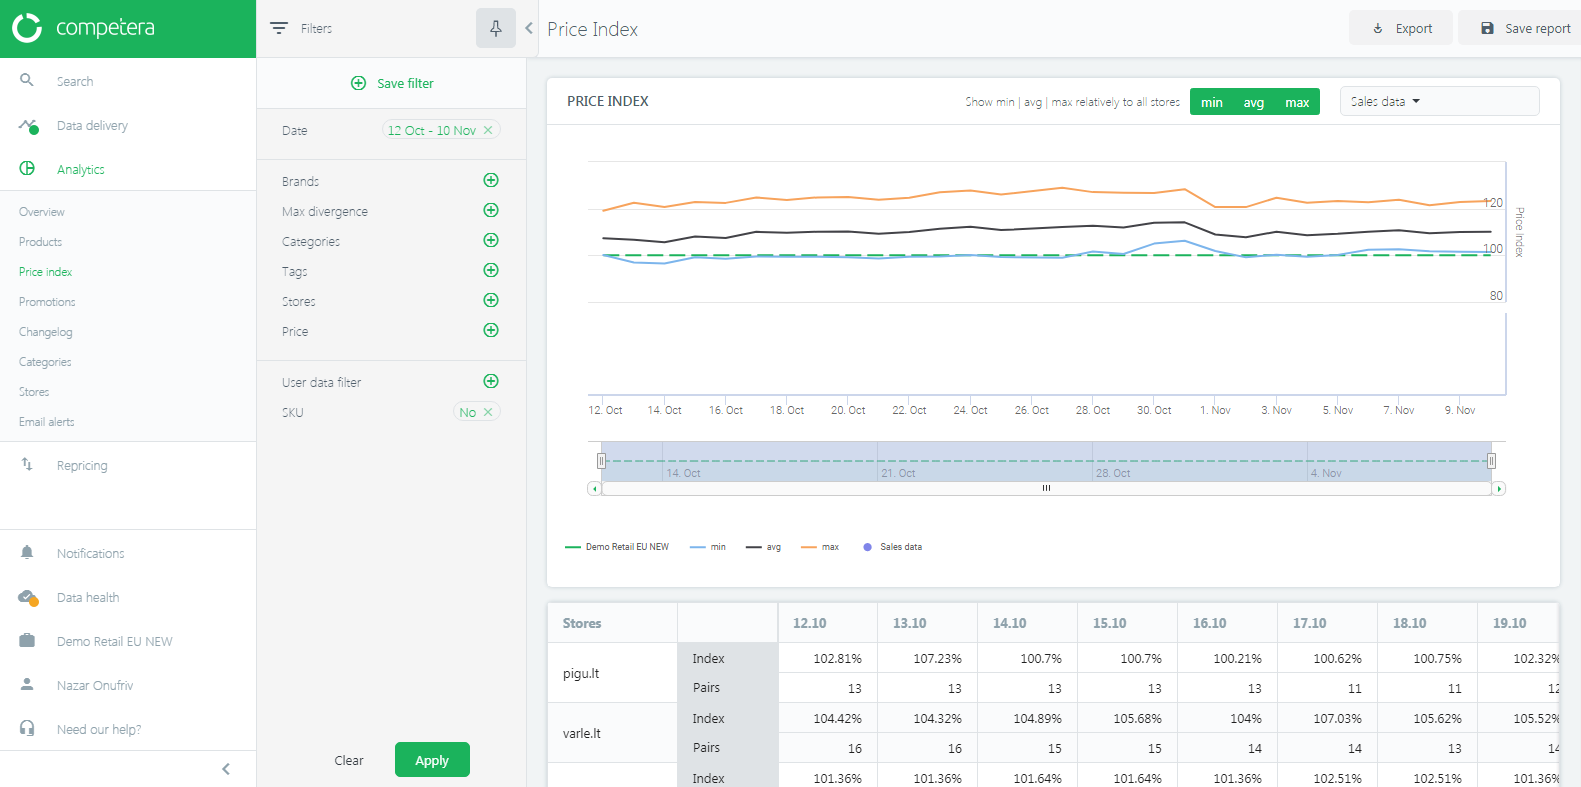
With Competera's pricing software, category managers get a comprehensive market vision and a precise understanding of the real assortment intersection with other retailers which helps to identify your direct competitors. If you define your key competitors correctly, you’ll be able to choose the best products for promotion, set competitive-yet-profitable prices, forecast demand and inventory, increase total sales by driving associated products, and much more.
Сomprehensive, fresh, and accurate pricing data is fundamental as it enables retailers to grow strategically by further implementation of automated pricing rules and price optimization. 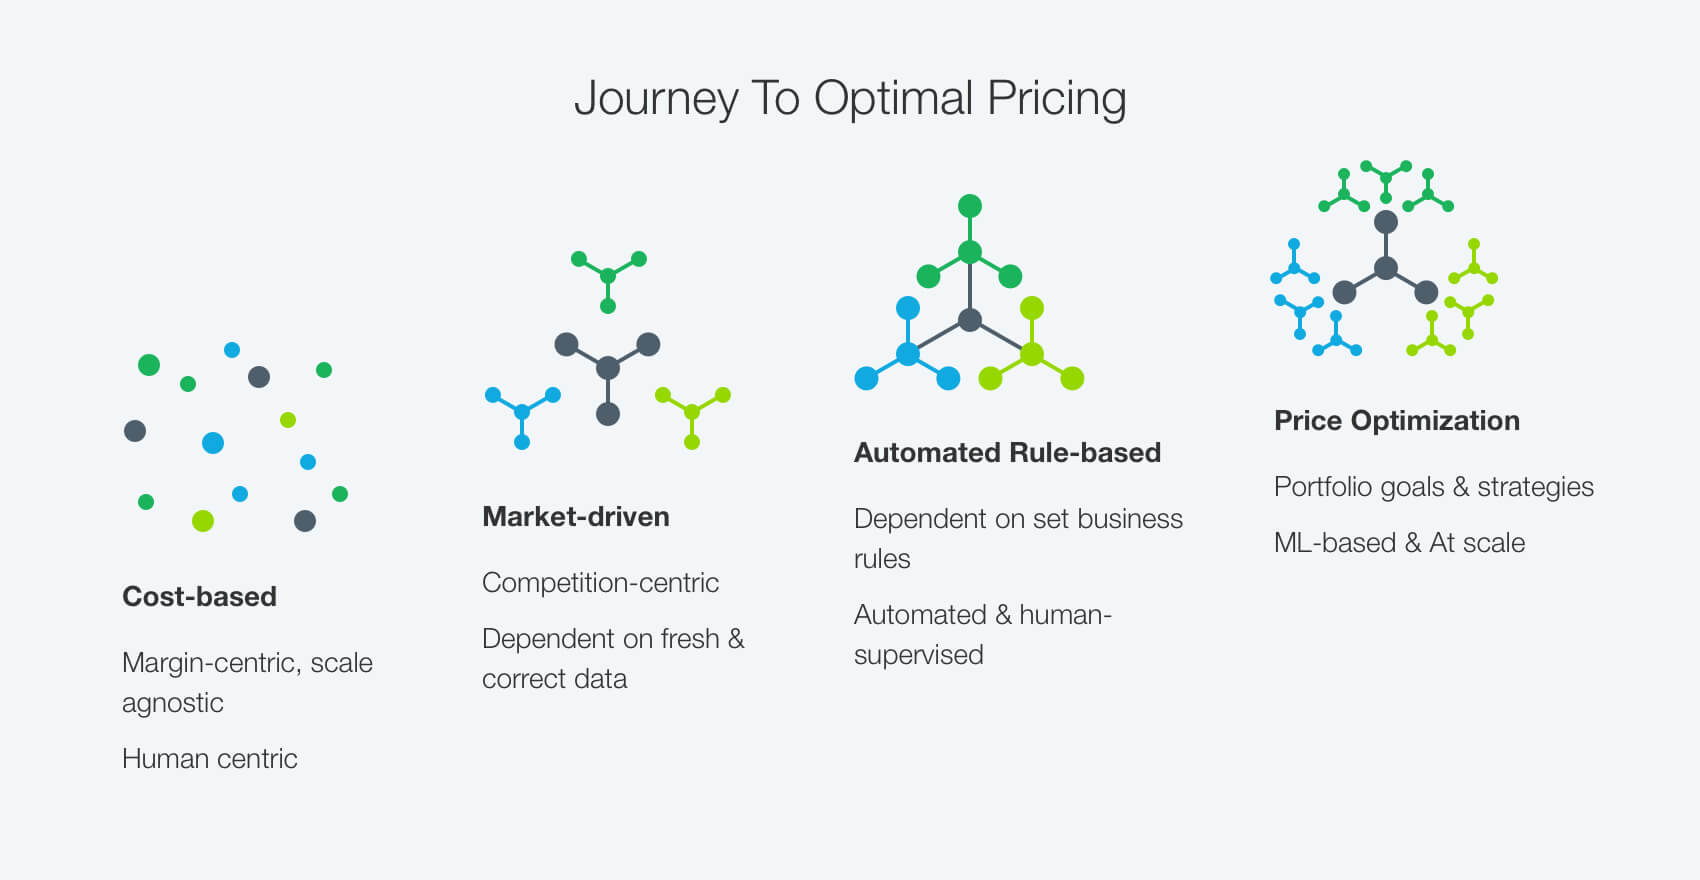
Using traditional and market-driven pricing can hardly help retailers to keep up with the rapidly changing retail environment and growing competition. At Competera, we believe that the future belongs to proactive rule-based pricing and price optimization. The retail leaders are already shifting to portfolio-level pricing with goal-driven scenarios based on ML/AI models.
No time for waste. Discover demand-based elasticity pricing to optimize your pricing strategy, align an assortment with the current customer needs, and make smarter business decisions!
Originally published at Capterra.
Unlocking the Benefits of the PI
- Strategic Pricing Insights: The PI empowers you to establish pricing guidelines at the company, category, and brand levels. By analyzing the CPI trends over time, you can gain valuable insights into your pricing competitiveness and identify areas for improvement.
- Holistic Performance Monitoring: Rather than fixating on individual product prices, the Price index provides a comprehensive view of your overall pricing performance. It helps you gauge how your pricing strategy fares against your rivals, enabling smarter decisions for optimization.
- Benchmarking and Goal Setting: The PI acts as a benchmark for your pricing strategy, enabling you to set realistic goals. Whether you aim to be the price leader or maintain a competitive position, the CPI guides you toward achieving the desired market positioning.
- Category and Brand Insights: With the PI, you can assess your pricing performance within specific categories or brands. Identify opportunities for adjusting your pricing strategies to align with market dynamics and meet consumer expectations.
FAQ
Price Index is a normalized average of price relatives for a particular category of products or services in a specific geographical region for a given period.
Consumer price index marks the average prices of a basket of consumer goods and services provided to customers (e.g., delivery, shipping). To calculate the consumer price index, you must consider price changes for each product in a basket and average them.
- Competera Partners with Sigma Software Group to Provide Competitive Advantages to the Retail Clients
- Competera Recognized Best Retail Insights Solution at the 2023 VIP Awards Presented by Vendors in Partnership and the National Retail Federation
- Behavioral Pricing: a Guide for Retailers