[Case study] Comfy analyzed price elasticity of demand for their customer acquisition channels and discovered new ways to increase their margins without losing conversions
2015-12-14

The wide range of products and strong price competition in the home appliances and consumer electronics market requires innovative pricing strategies and tactics. To find new ways to increase margins, Comfy looked more closely into their conversion rates during price spikes and analyzed the price elasticity of demand for their customer acquisition channels, product categories, and product brands.
- To analyze how the conversion rate changes when product price deviates from average in the market.
- To calculate buyers price sensitivity within acquisition channels, product groups and brands.
- Comfy developed new pricing scenarios which take into account the main customer acquisition channels.
- Advertising tactics were changed for paid traffic sources and a new policy for CPA partners was implemented.
- New methods were discovered for automatic repricing to increase margins without losing conversions.


In order to perform the analysis, Competera tracked and collected competitors’ prices in near real-time and sourced conversion rate data from Comfy. To perform tests and calculations on the data, the following tools were used:
- Google Analytics Enhanced Ecommerce
- Competera price intelligence suite
All the data was loaded to Google BigQuery, which allowed immediate access to current market data and helped visualize the analysis results. Price sensitivity coefficients were calculated as the correlation between the conversion rate for the product n over the period T (t1, t2 … ti ... tn) and the price difference between the product n and the market average at a moment f, where |ti - f| < 4 hours. Conversion rates were calculated as the ratio of all unique purchases of product n to total views of this product's detail page over the period T.
The calculation results:
Price sensitivity coefficients
Price sensitivity coefficients were calculated as the correlation between the conversion rate for the product n over the period T (t1, t2 … ti ... tn) and the price difference between the product n and the market average at a moment f, where |ti - f| < 4 hours.
Conversion rates
Conversion rates were calculated as the ratio of all unique purchases of product n to total views of this product's detail page over the period T.
The calculation results:

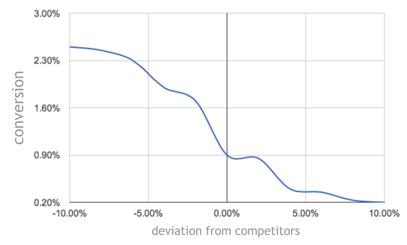
This line graph shows how the conversion rate (y-axis) varies with the price difference (x-axis) from the competitors at the time of conversion.

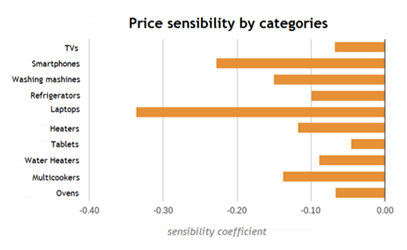
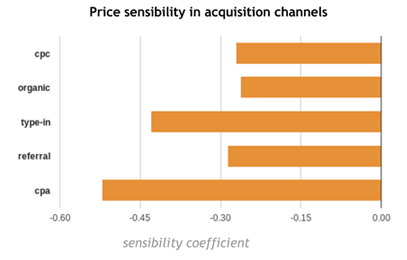
The further the coefficient deviates from zero, the stronger the correlation between conversions and price deviations from the market average. Negative price sensitivity indicates an inverse relationship between sales and pricing: the lower the price, the higher the sales numbers.

These results made it possible for Comfy to develop new pricing scenarios, which take into account the main customer acquisition channels. Now Comfy was able to correct the advertising strategy in paid traffic channels, and revise their policy for the CPA partners. This analysis also helped to find new ways to automate pricing for improved margins at a target conversion rate, which led to greater profitability of Comfy's online operations.


