
Content navigation:
- What is safety stock?
- Controlling safety stock: think of service level
- Safety stock formula
- Safety stock calculation for better distribution
- Determine safety stock: let the soft do the job
What is safety stock?
Safety stock is a category used by retailers and logistics specialists to specify a level of extra stock that the business should keep to make sure the risk of unfavorable stock-out (with targeted service level unsatisfied) is minimized. Accurate safety stock calculations are crucial to ensure that the retailer is hitting long-term targets with financial performance being aligned with forecasts.
Making business in each segment has its own rules. However, the importance of safety stock is crucial across all the retail industries from grocery, consumer electronics or DIY to footwear and apparel with their dependancy on seasonality. In each case, relevant predictions remain and will always be one of the crucial prerequisites of a retailer’s success. This article will shed light on how to calculate safety stock and align it with optimal service level based on correct distribution forecasts and what has advanced software to do with it.
Controlling safety stock: think of service level
It won’t be an exaggeration to say that retailers are struggling with each other to offer a better experience to their clients. The point is that consumer needs and interests are integral in retail and there's hardly a more valuable asset than a satisfied customer. But how to set objectives and measure an ambiguous customer satisfaction? Well, the category of service level gives the answer.
To put it simply, service level marks the number of clients left satisfied by the business. Covering 100% of consumer requests doesn’t make sense economically. That's why retailers have to seek a balance between satisfying as much consumers as possible without losing sales or profit margin.
Most often, service level is defined as a probability of not hitting a stock-out or the probability of not losing sales. The definition shows that level of stocks is one of the most important aspects while considering service level.

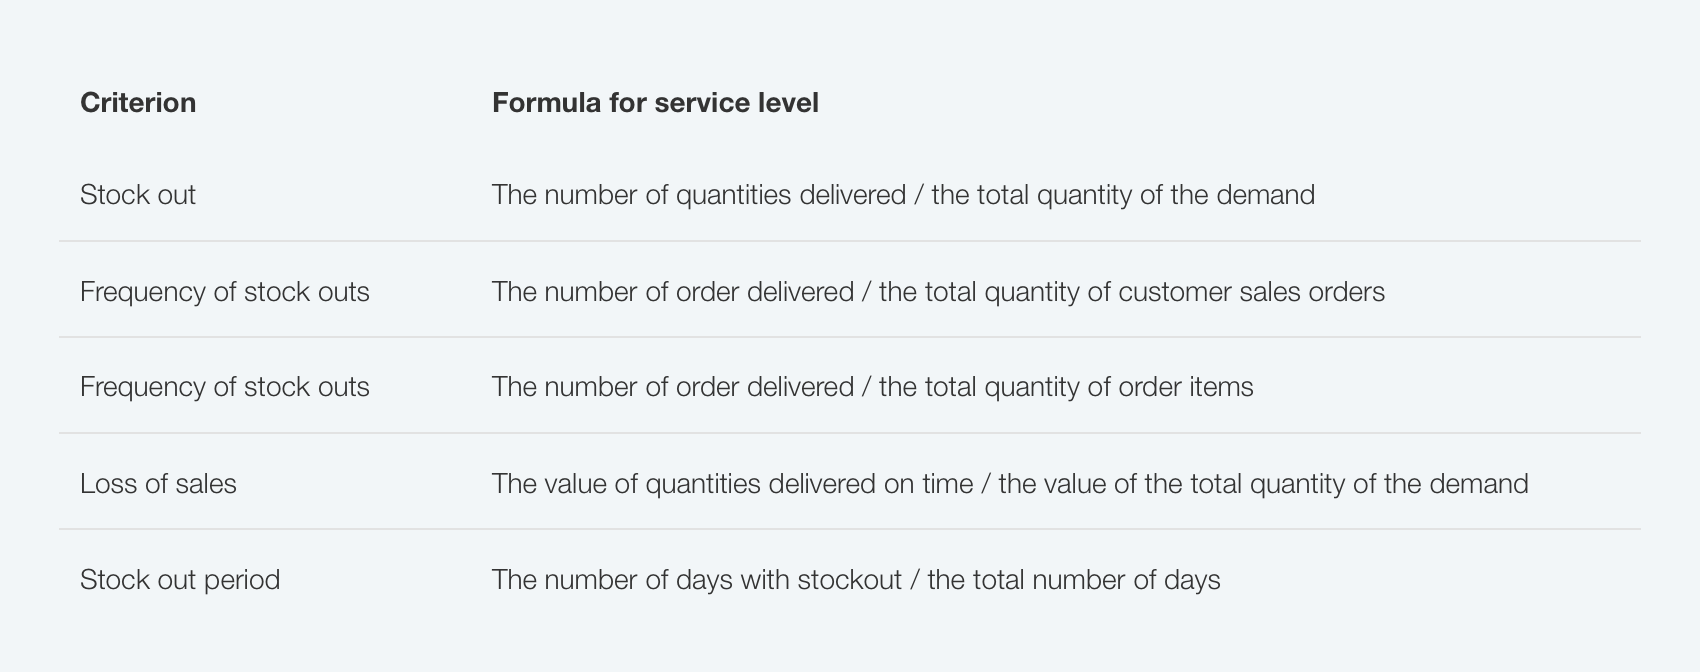
The correlation between the quantity of delivered products and demanded ones is the most common way to calculate service level. However, depending on industry, market segment or retail type, the other criteria could also be applied. The table below shows the most common ones.
Here is an example: if you sell shoes and there are rare types of size in your assortment range, you cannot afford to have too much of them in stock. That’s why, you need to define service level to mark the number of customers that will definitely find their rare shoes in a store. So, if you’re targeting service level of 95% than it means 95 of 100 shoppers will get the requested product on time.
Safety stock formula
Everyday, managers and their pricing teams have to deal with a plethora of uncertainties. These may include variations in replenishment plan, demand fluctuations or delivery time mismatches as a result of agreement violations by vendors. To deal with this kind of issues, retailers keep safety stock as an extra inventory minimizing the risk of stock out or other negative events.
In general, the two basic options to define safety stock are considered. The first one implies calculations based on historical distribution while the second one is built upon the distribution rate expected in the future.

This formula implies that the demand is distributed normally during the replenishment lead time. ‘Safety factor’ in the model marks a number of standard deviations corresponding to a specific service level.
Basic formulas similar to the one outlined above require additional evaluations to validate the results. First of all, the demand deviations are worth being considered. In this context, the standard deviation formula appears to be one of the most useful means of evaluating service level and safety stock.

This standard deviation model is applicable primarily for the cases of normal distribution. Yet, there is hardly any large retailer who does not have products in an assortment range to which this model of distribution is inapplicable. That’s where we need to look more onto the major types of distribution.
Safety stock calculation for better distribution
Efficient inventory planning and management are good indicators of retailer's financial health. Distribution models are, in turn, essential in inventory planning as they help retailers to find how many items of each product should be in stock. To estimate uncertainty in demand planning, retailers use distribution models divided into three main types: uniform, triangular, and normal one.
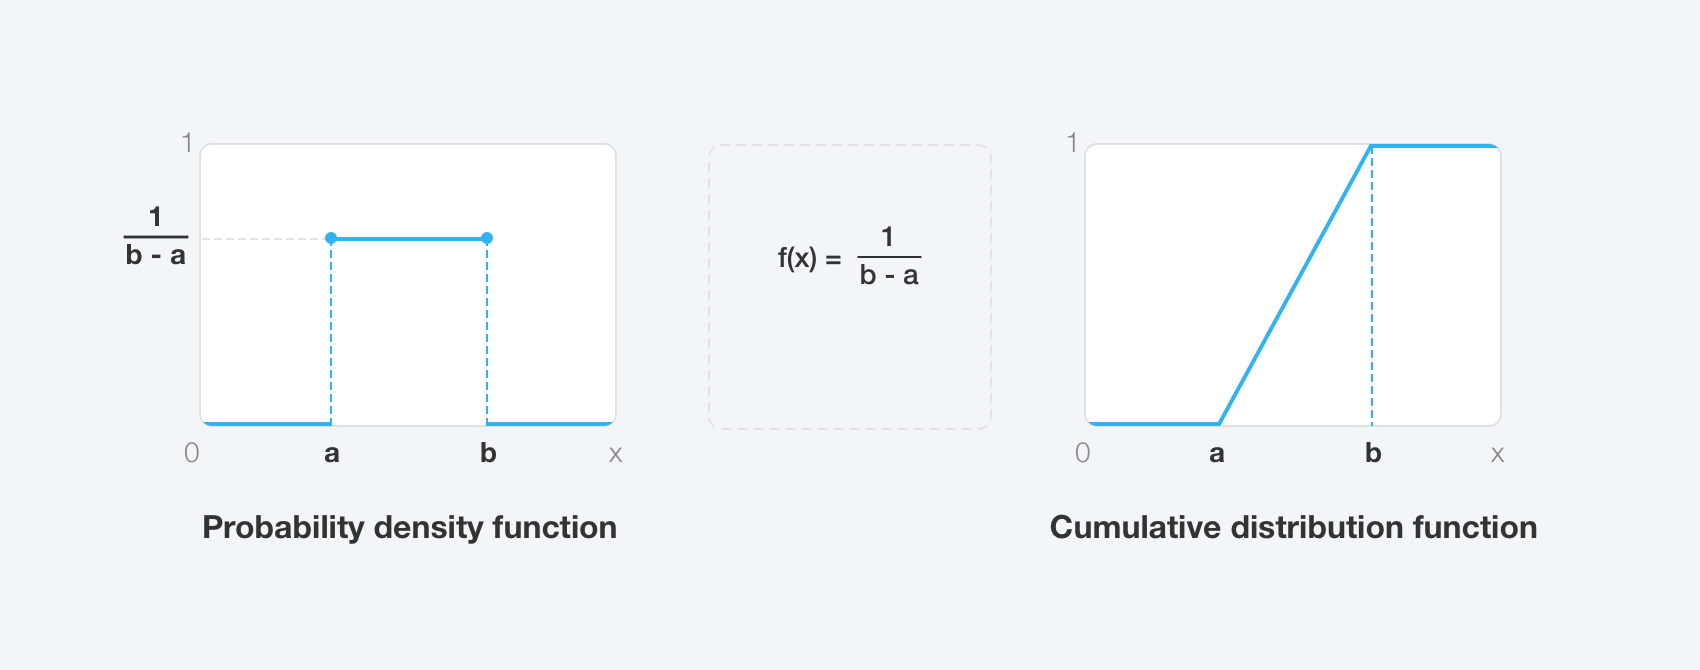
The uniform distribution model represents the simplest and the most conservative estimate of uncertainty. The distribution models gives the largest standard deviation as it presumes that the two end points of distribution (a, b) are known. The model also implies that each effect on value within the frame between a and b are equal regarding uncertainty.
In other words, If X has a uniform distribution where a < x < b or a ≤ x ≤ b, then X might take any value between a and b (including a and b). All values of x are equally likely to happen. In uniform distribution, X ∼ U (a, b). The mean of X is, therefore, counted as follows: μ = (a+b)/2. The variables in a uniform distribution model are referred to as uniform random variables; the variance of uniform random variable counts as Var(x) = (1/12)(b-a)2. Building cumulative distribution is then used to define a number of products a retailer should have in order to correspond to a particular service level rate. The following formula is used to calculate a probability density function:
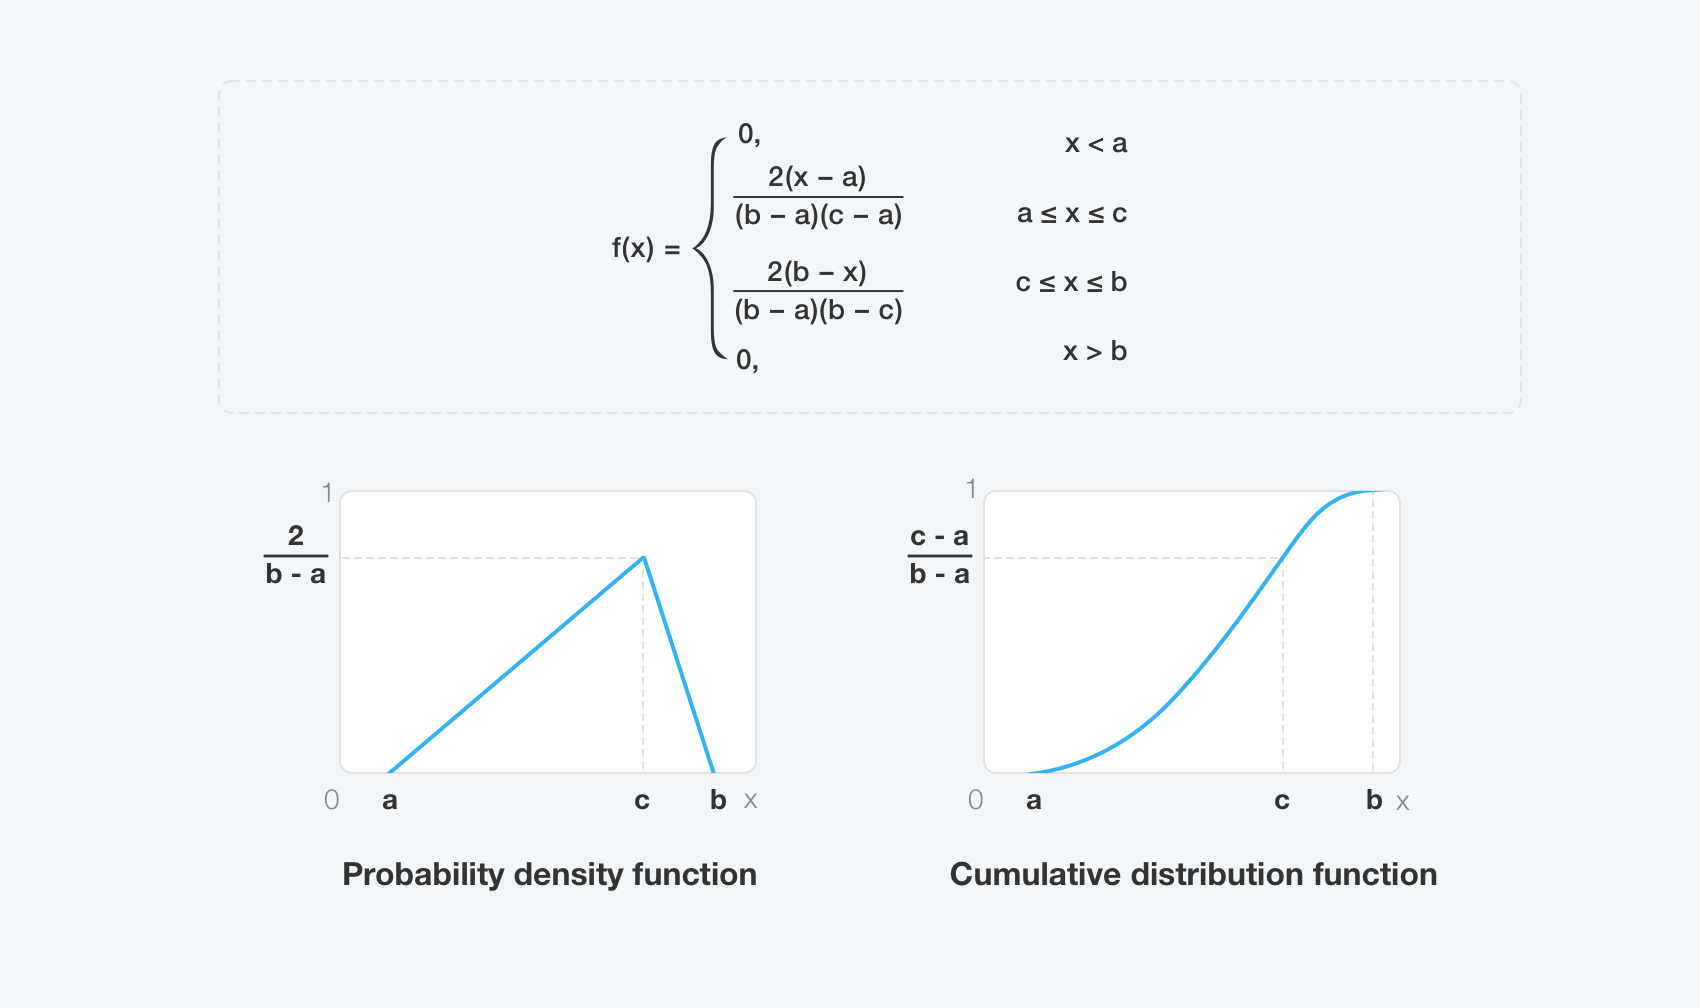
The triangular distribution model is more accurate as it's less conservative in terms of estimating uncertainty giving smaller deviation compared to uniform model. The model also assumes the distribution's end-points (a,b) are known. Subsequently, the triangular distribution's mode occurs at zero. In this type of model, X follows a triangular distribution with a minimum of a maximum of b and mode (peak value) of c.
Here is an example: a bakery franchise is planning to open a new outlet and uses triangular distribution to model weekly sales. Considering sales statistics in another location, the managers expect minimum weekly sales to count as $1000 (a), maximum point as 6000$ (b), and the mode around 3000$ (c). These standings are needed to draw a distribution function which is then used to calculate a number of products needed to meet a service level targeted by a franchise. The probability density function in model is calculated as follows:
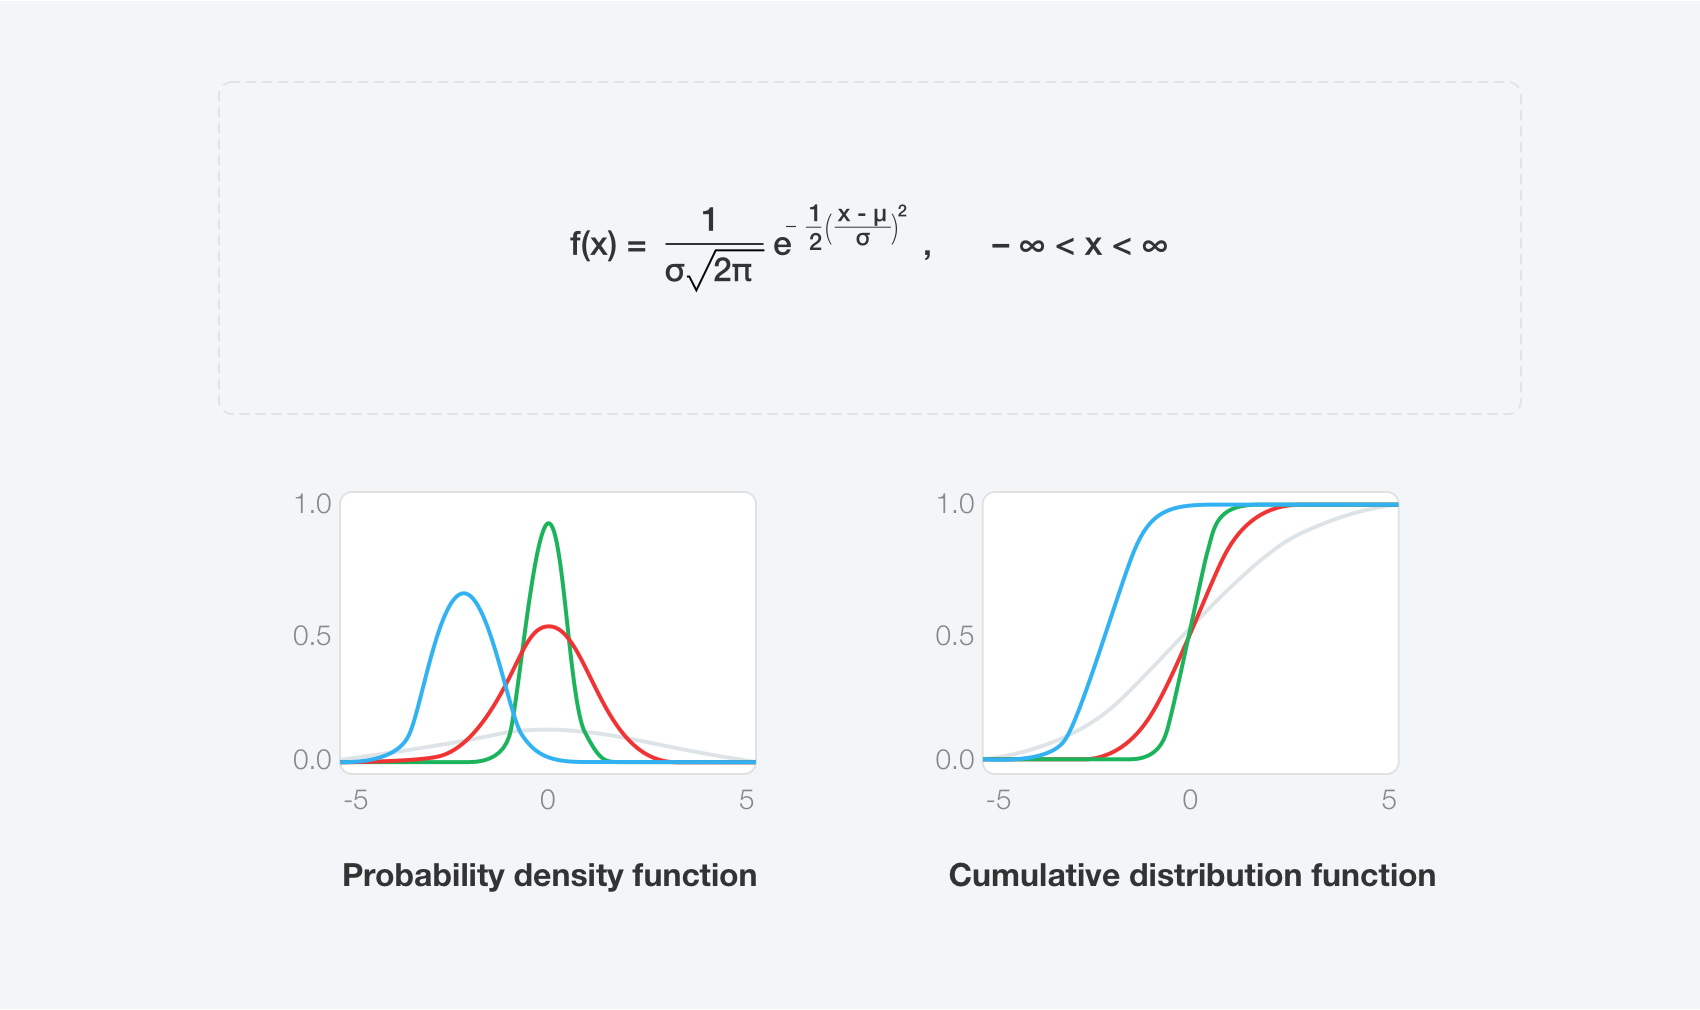
The normal distribution offers less conservative estimate of uncertainty compared to both triangular and normal distribution. It means that the model also implies the smallest standard deviation. The latter is calculated assuming that a and b points cover 99.7% of distribution. The model gives a good understanding of a particular event’s probability extent and, therefore, is frequently used for setting safety stock.
The model describes well the distribution of random variables that arise in practice, like annual sales. The normal distribution can be described completely by the two parameters µ (mean) and σ (standard deviation). Random variable X follows the normal distribution if the probability density function of X is given by the following formula:
Determine safety stock: let the soft do the job
The less conservative model is in terms of estimating uncertainty, the better. However, the choice always depends on available data, product, industry, and range of other factors. What is clear is that making manual calculations for each parameter necessary to predict demand is not only time-consuming but also vulnerable to mistake.
And that’s where software can help. To help retailers build up optimal value offering, we’ve powered Competera’s pricing platform with AI algorithms that are trained and optimized constantly to deliver accurate and timely predictions. You can use the platform not only to predict the demand or find the optimal safety stock but also to hit the targeted stock level while keeping margins at maximum possible rate.

But let us say it again: implementing even the most advanced tech solutions, like Competera, cannot be sustainable and effective without understanding the essential principles and market laws underlying retail. The brief outline of essential models used to evaluate service level, safety stock, and distribution is fundamental for further exploration of the retail forecasting. Stay tuned and explore our resources section to get more insights into the retail business.
FAQ
Safety stock is a category used by retailers and logistics specialists to specify a level of extra stock that the business should keep to make sure the risk of unfavorable stock-out (with targeted service level unsatisfied) is minimized.
To estimate uncertainty in demand planning, retailers use distribution models divided into three major types: uniform, triangular, and normal one.
Most often, retailers use advanced software to predict the demand, find the optimal safety stock or set prices so they can hit the targeted stock level while keeping margins at maximum possible rate.