
Many companies are still struggling to take into account customer lifetime value (LTV). However, it is an important step since by measuring LTV, you can learn more about the value a customer brings to your company during the entire customer life cycle.
But how can you improve LTV? Make your customers fall in love with your business and come back for more by making your communication with them more personal.
Now let’s move from theory to the real world. One of the most popular ways to personalize communication with customers is to segment them based on their buying activity.
First things first: collecting data for analysis
In order to build relevant segments you need to combine in one data warehouse — Google BigQuery — such data:
-
Raw unsampled data about user behavior sent in near-real time
-
Information about all orders, including completed orders (online, offline, by phone)
-
Customers’ UserIDs along with their personal data (name, gender, birth date, email address, phone number, registration date, loyalty program status, email and SMS subscriptions, etc.)
-
Information about customers’ buying activity (number of orders)
There are several services that can help you to automatically collect all this information, for example, OWOX BI Pipeline.
Data’s in the house. What should we do next?
After combining data from your CRM and GA, you need to build customer segments. When setting the time period for segmentation, you can use the consumption cycle time of the customer base. The consumption cycle time is the median number of days between two neighboring orders. To find your consumption cycle time, take the number of days between online orders and the number of days between offline orders, then calculate the weighted mean number of days for both types of orders.
Next, identify your main customer segments based on the calculated time period for each segment. For example, you can divide customers into new members, old members, new buyers, good buyers, etc.
Having specified the conditions for segmentation, you can now create a schema of ways in which users transition between these segments. This is necessary to see how users migrate from one segment to another within the analyzed time period and after you communicate with them through digital and direct marketing channels.
As experience shows, the next step is to work with an SQL query to form a table with the main efficiency metrics for each of the segments:
-
Number of users in the segment and the percentage of the customer base represented by the segment
-
Number of orders for the segment, both total and completed
-
Average revenue per user within the segment
-
Average number of orders per user within the segment
-
Total number of orders for the segment and the segment’s share in the general turnover
-
Change in the number of users in the segment (growth rate)
The fun part: creating reports
After you process the necessary data, you need to import it from Google BigQuery to whatever visualization tool you prefer to create meaningful reports using three tables:
1. A table that shows users who moved to another segment and who remained in the same segment:
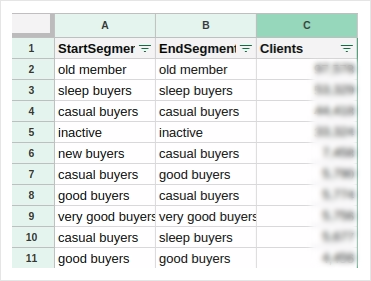
The Clients column shows the number of users, the StartSegment column shows the user segment for the previous period, and the EndSegment column shows the user segment for the current period.
2. A table that shows data on each user within a set time period:
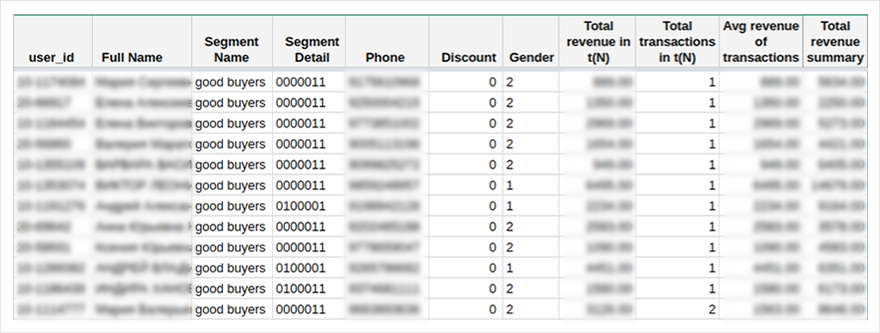
This table, as an example, displays a list of current customers who are members of each of the segments. It also shows all personal user data for direct communication: email address, phone number, birth date, name, gender, loyalty program status, average revenue per user, and total number of bonus points. With this data in hand, your marketing specialists can set up personalized ads for each user segment.
3. A table that displays metrics of buying activity across customer segments within the analyzed time period and compared to the previous period:
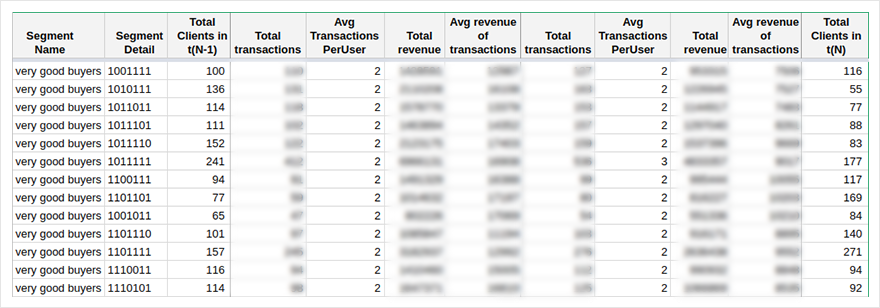
This report helped BUTIK, an online store for clothes, footwear, and accessories, to increase their LTV by tracking user growth in each of the active segments (Good Buyers, Very Good Buyers, New Buyers).
Conclusion
By making communication with your customers more personal, you can grow faster than your competitors who write one type of email for everyone in their target audience. Collect complete and detailed data in a single cloud warehouse in order to create customer segments and automatically create reports. Voilà — you can manage your marketing budget more effectively and make more profit by engaging with active customers and making them buy more often.